Interpreting SAR imagery#
Near-real time SAR imagery is often made available during cruises for ice navigation purposes. It can be useful to be able to do a basic interpratation of a SAR image to assess the sea ice conditions in an area.
Below is a brief for-dummies-guide to do a quick amateur interpretation of SAR imagery. For any questions, there are many experts on the house, including:
Anca Cristea (data section)
Polona Itkin (sea ice section)
Dimitry Divine (sea ice section)
Principle#
Synthetic Aperture Radar (SAR) imagery uses microwave signals to capture high-resolution images of Earth’s surface, regardless of weather or lighting conditions.
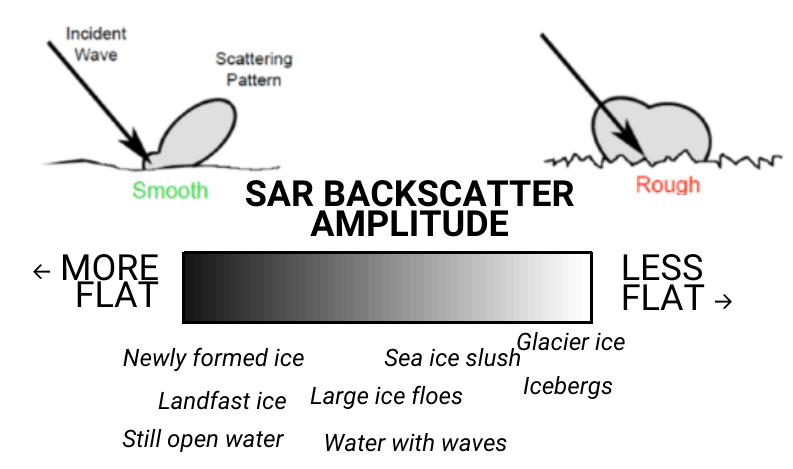
For sea ice and oceanography, SAR measures the surface roughness and texture of the ocean or ice. Smooth water reflects most of the radar signal away from the sensor, therefore very little signal is scattered back to the sensor (low amplitude / dark), while rougher surfaces, such as ice floes or wind-affected water, scatter more signal back toward the satellite (high amplitude / light).
Tips for interpreting SAR images
Darker color = lower backscatter = smoother surface
It can be really hard to distinguish e.g. a calm ocean from very thin sea ice, or wind-influenced ocean from broken up sea ice. Use other sources of information to get context for what you are seeing!
Consecutive SAR images help you assess the movement and persistence of features - compare with SAR images taken shortly before or after to better understand what you are looking at.
Compare with other products (e.g. lower-resolution AMSR sea ice concentration) to confirm your overall interpretation (e.g. “is this large patch ice or open water”?)
Don’t make too much of the absolute amplititude, it can change between images anf from the centre to the edges of a single image.
Look for features and gradients
Look at texture at various scales
Experiment with the saturation and color scale!
There is a bit of an art to this - it is a good idea to train your eye on other sets SAR images before e.g. having to do this in the field.
Examples#
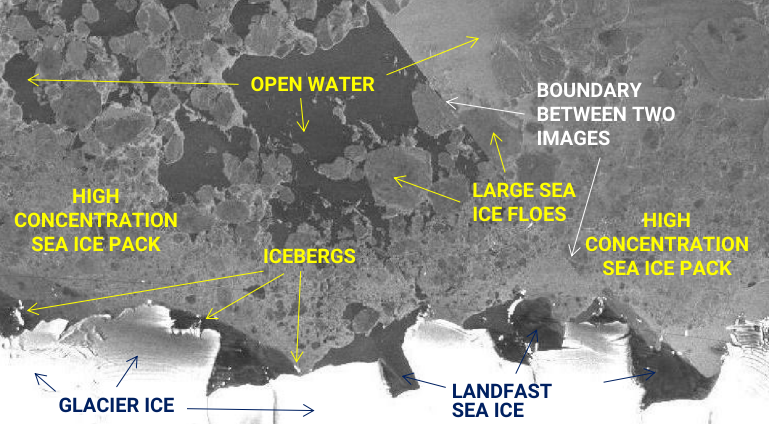
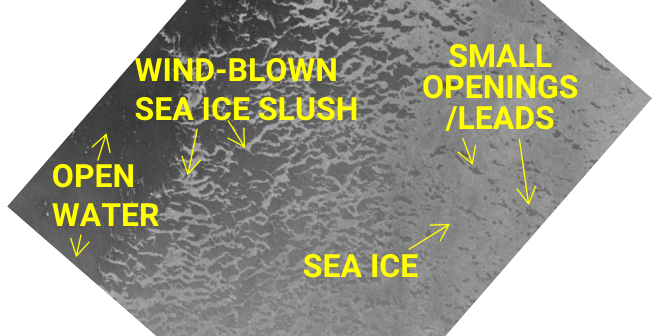
Example SAR image mosaic from the Southern Ocean with qualitative labels.
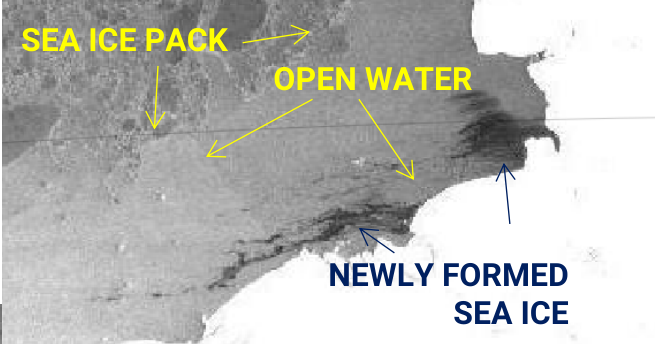
Example SAR image from the Southern Ocean with qualitative labels. Dark patches are likely newly forming ice.
Example SAR image from the marginal ice zone in the Southern Ocean.